This is part 1.1 of a number of blog posts on parallel stream compaction
In part 1 we saw that the parallel stream compaction Cuda software by Billeter et al. is faster than the software by Orange Owls , which in turn is faster than the software by Spataro. Commenter Qubey then asked if this relative order is preserved under migration to other graphics cards, notably to graphics cards with newer generations GPU’s. This is an important question because it addresses the validity of a choice for a particular algorithm (and its implementation) for future hardware. This validity depends largely on adherence to an architectural model in successive hardware generations and the software runtime environment.
We set out to experiment. All three implementations will be run with structured data for streams of size 2^10 up to and including 2^26. Structured data is of the form 1, 0, 3, 0, 5, 0, 7, 0, … Values are limited to [0, 2^16 – 1]. We have seen in part 1 that the algorithms are not sensitive to structure in the input data. This was also found in the extensive experiments reported on here (although we will not discuss it further). The implementations of Orange Owls and Spataro will be run for 32, 64, …, 1024 threads per block. The thread layout of the Billeter et al. implementation is fixed. We ran this software on various graphics cards: a GeForce GTX 660, 690, 960 and 1080. Time performance measurements are averaged over 1,000 calls of the kernel.
The questions we would like to see answered are:
- Is the relative ordering in time performance of the implementations preserved over the different graphics cards?
- Is the time performance relation between the fastest implementation and the runner up implementation constant over the different graphics cards? Can we say that implementation X Is Y times faster than implementation Z?
Relative order
The first question can best be answered by presenting time performance graphs of the cards involved.
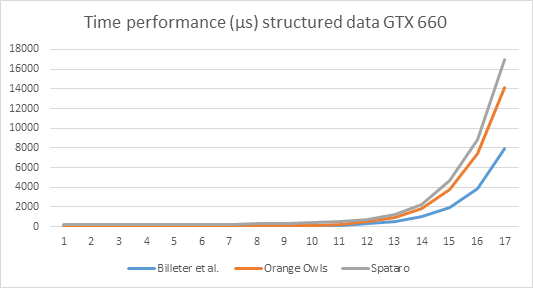
Explanation of the numbers on the x-axis: x=1 means the input length is 2^10, x=2: input size is 2^11, … x=17: input size = 2^26. This holds for all graphs below.

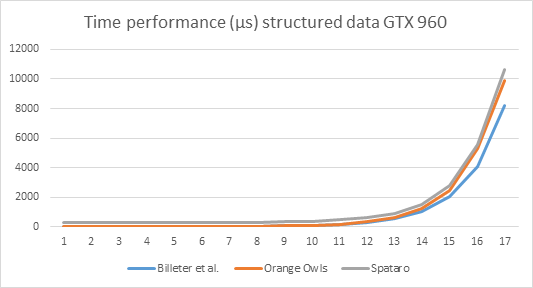

It is obvious from the graphs that relative ordering of performance is preserved over the cards.
Note by the way the enormous increase in time performance. The GTX 660 takes almost 8ms to process the largest stream (2^26 elements) using the Billeter et al. algorithm, whereas the GTX 1080 needs only 3ms.
Magnitude
The data from part 1 suggests that there is a multiplicative relation between the fastest algorithm: Billeter et al., and the runner up: Orange Owls. The data from the current test set support this suggestion, as the following graphs illustrate.
The graphs below show (i) the Orange Owls time performance measurements divided by the Billeter et al. measurements; (ii) Spataro divided by Billeter et al.; and (iii) Spataro divided by Orange Owls.
We see that the division of the Orange Owls data divided by the Billeter et al. data, reasonably approximates a straight line, indicating an approximately constant factor on all cards. This will allow us to say something like “The implementation by Billeter et al. is X times faster than the implementation by Orange Owls.” The other two relations are clearly not of this nature.


We see that there is indeed a multiplicative relation between the Billeter et al. and Orange Owls time performance data. So what is the magnitude of these relations for the different cards, and are they more or less the same? Take a look at the table below.
| Card | Mean | Standard deviation |
| GTX 660 |
1.6 |
0.2 |
| GTX 690 |
1.7 |
0.2 |
| GTX 960 |
1.3 |
0.1 |
| GTX 1080 |
1.6 |
0.3 |
| All data |
1.5 |
0.3 |
As you can see, mean and standard deviation are similar over the cards, with the exception of the GTX 960. I’ll get to that. Based on these results, I’m inclined to say that Billeter et al. stream compaction is about 1.5 times as fast as Orange Owls stream compaction.
On the other hand, the magnitude of the multiplicative relation seems to be about 1.6, with the notable exception of the GTX 960. We note that the theoretical memory bus bandwidth of the GTX 960 is (only) 112 GB/s for the reference card and 120 GB/s for OEM cards (Wikipedia), whereas the bandwidth of the GTX 660 is 144 GB/s, and for the 690: 192 GB/s (per GPU).
The time performance comparison chart for all cards on structured data, Billeter et al. implementation looks like this:

Which shows that the GTX 960 is relatively less suited for stream compaction compared to the other cards.
Wrapping up
In part 1: Introduction, based on one graphics card and a single input stream size, Billeter et al. came out twice as fast as Orange Owls. This finding has now been developed into a factor 1.5 by the introduction of a broad spectrum of cards and a far broader scope of input streams. We have seen that Billeter et al.’s implementation of stream compaction is the fastest, for a substantial number of input stream lengths and over a number of graphics cards generations.
Next
Next we will start digging into the inner workings of the algorithms, as promised in the introduction.
Thanks
I would like to express my gratitude to Qubey for his sharp questions and for his willingness to conduct experiments on the GTX 660, 960 and 1080 cards.
